

STORY Dashboard

Overview
To set up an effective node monitoring system, we’ll use three main tools:
- Prometheus: Collects and stores metrics.
- Node Exporter: Gathers metrics from the system and hardware.
- Grafana: Displays data in graphs and dashboards.
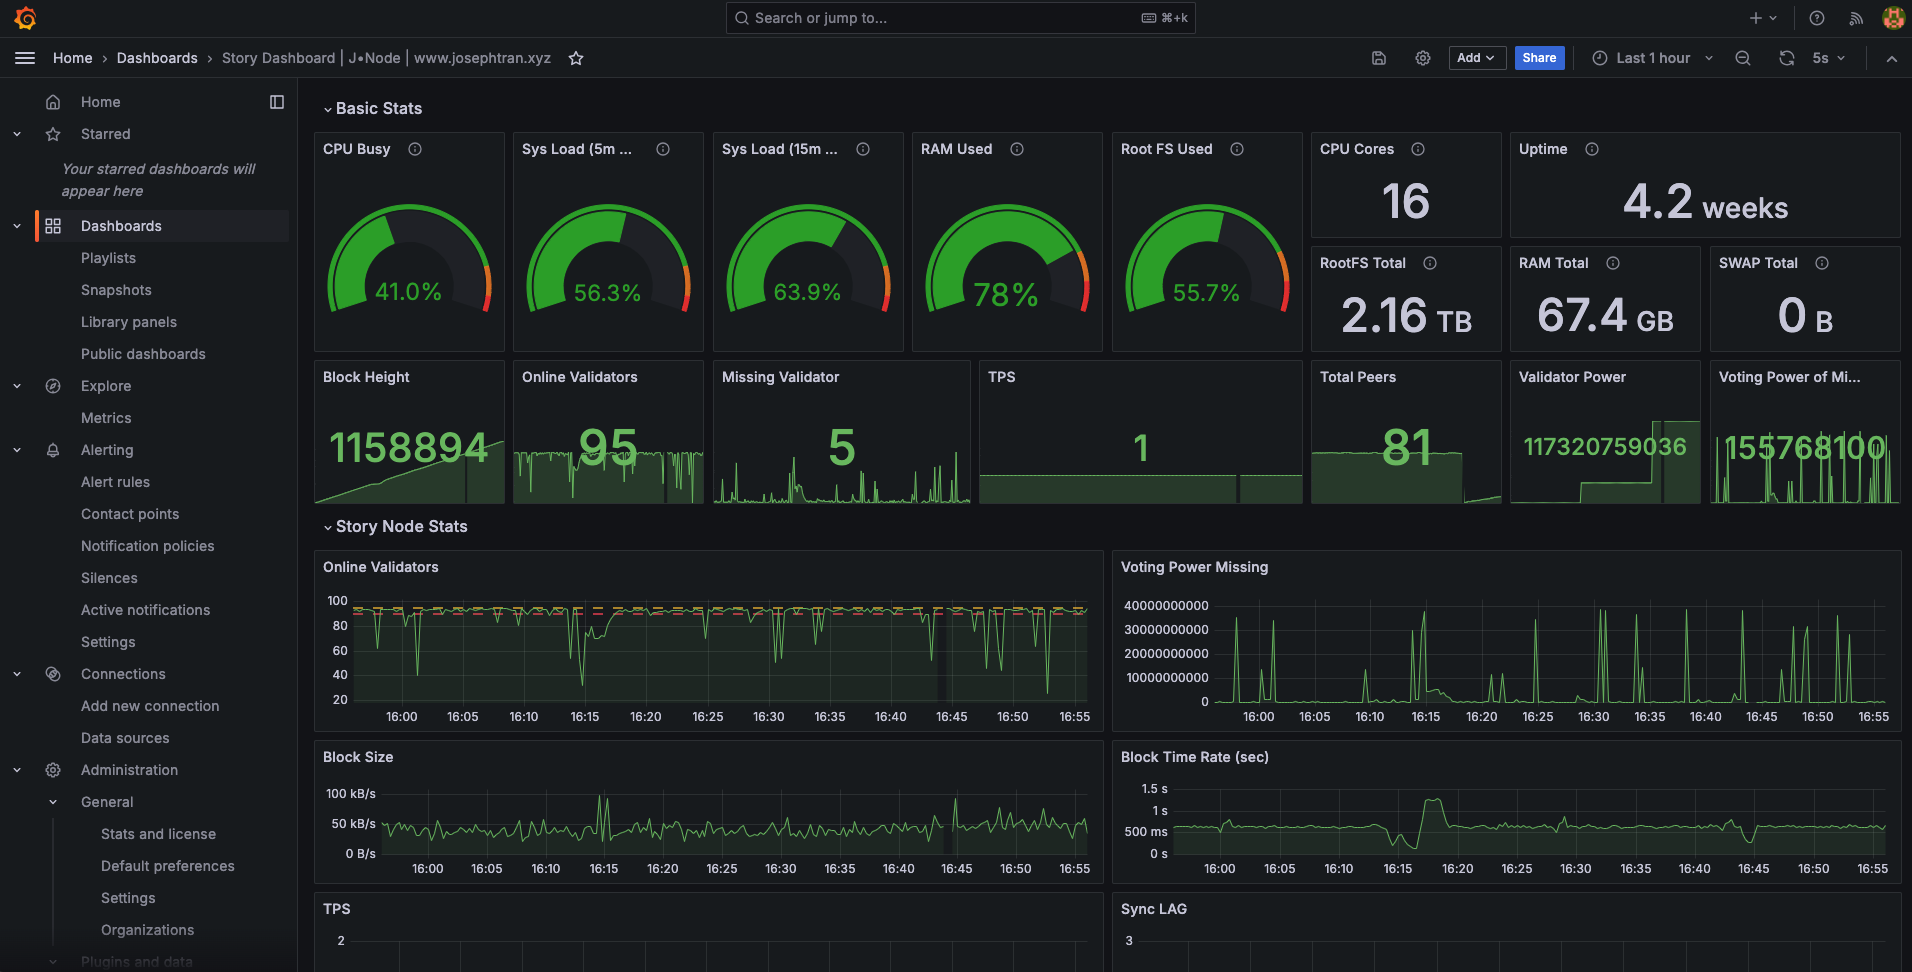
Preview: https://story-dashboard.josephtran.xyz/ | username: user | password: 123456
System Requirements
- Operating System: Ubuntu 20.04 LTS or newer
- RAM: Minimum 2GB
- CPU: 2 cores or more
- Disk Space: At least 20GB free
Implementation Steps
1. Installing Prometheus
Prometheus is an open-source monitoring system and time series database.
- Download and install Prometheus:
cd $HOMEwget https://github.com/prometheus/prometheus/releases/download/v2.42.0/prometheus-2.42.0.linux-amd64.tar.gztar xvf prometheus-2.42.0.linux-amd64.tar.gzsudo mkdir -p /opt/prometheussudo cp -r prometheus-2.42.0.linux-amd64/* /opt/prometheus/rm -f prometheus-2.42.0.linux-amd64.tar.gz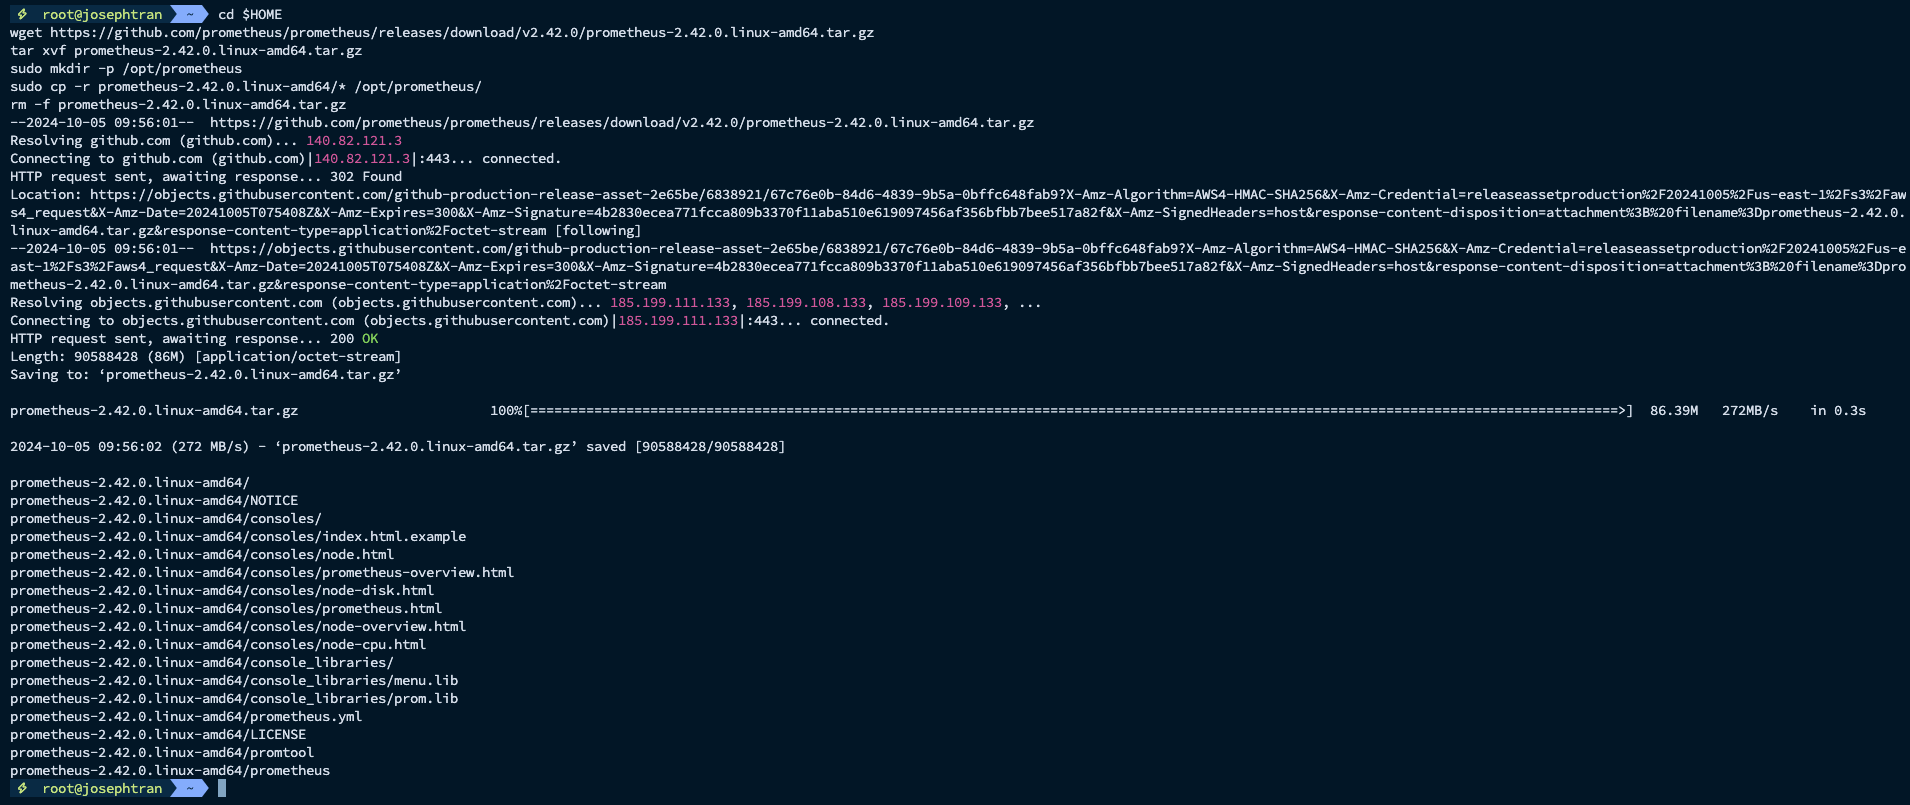
- Create Prometheus user:
sudo useradd --no-create-home --shell /bin/false prometheus- Create necessary directories:
sudo mkdir /etc/prometheussudo mkdir /var/lib/prometheussudo touch /etc/default/prometheus- Configure permissions:
sudo chown -R prometheus:prometheus /etc/prometheus /var/lib/prometheus /opt/prometheussudo chmod 755 /opt/prometheus/prometheus- Create Prometheus configuration file:
sudo nano /etc/prometheus/prometheus.yml- Insert Prometheus configuration content:
# Sample config for Prometheus.
global:  scrape_interval:     15s # Set the scrape interval to every 15 seconds. Default is every 1 minute.  evaluation_interval: 15s # Evaluate rules every 15 seconds. The default is every 1 minute.  # scrape_timeout is set to the global default (10s).


# Attach these labels to any time series or alerts when communicating with# external systems (federation, remote storage, Alertmanager).

# Alertmanager configurationalerting:  alertmanagers:  - static_configs:    - targets: ['localhost:9093']
# Load rules once and periodically evaluate them according to the global 'evaluation_interval'.rule_files:  # - "first_rules.yml"  # - "second_rules.yml"
# A scrape configuration containing exactly one endpoint to scrape:# Here it's Prometheus itself.scrape_configs:  # The job name is added as a label `job=<job_name>` to any timeseries scraped from this config.  - job_name: 'prometheus'
    # Override the global default and scrape targets from this job every 5 seconds.    scrape_interval: 5s    scrape_timeout: 5s
    # metrics_path defaults to '/metrics'    # scheme defaults to 'http'.
    static_configs:      - targets: ['localhost:9090']
  - job_name: node-exporter    # If prometheus-node-exporter is installed, grab stats about the local    # machine by default.    static_configs:      - targets: ['PUBLIC_SERVER_IP:9200']
  - job_name: 'Story'    static_configs:      - targets: ['PUBLIC_SERVER_IP:26660']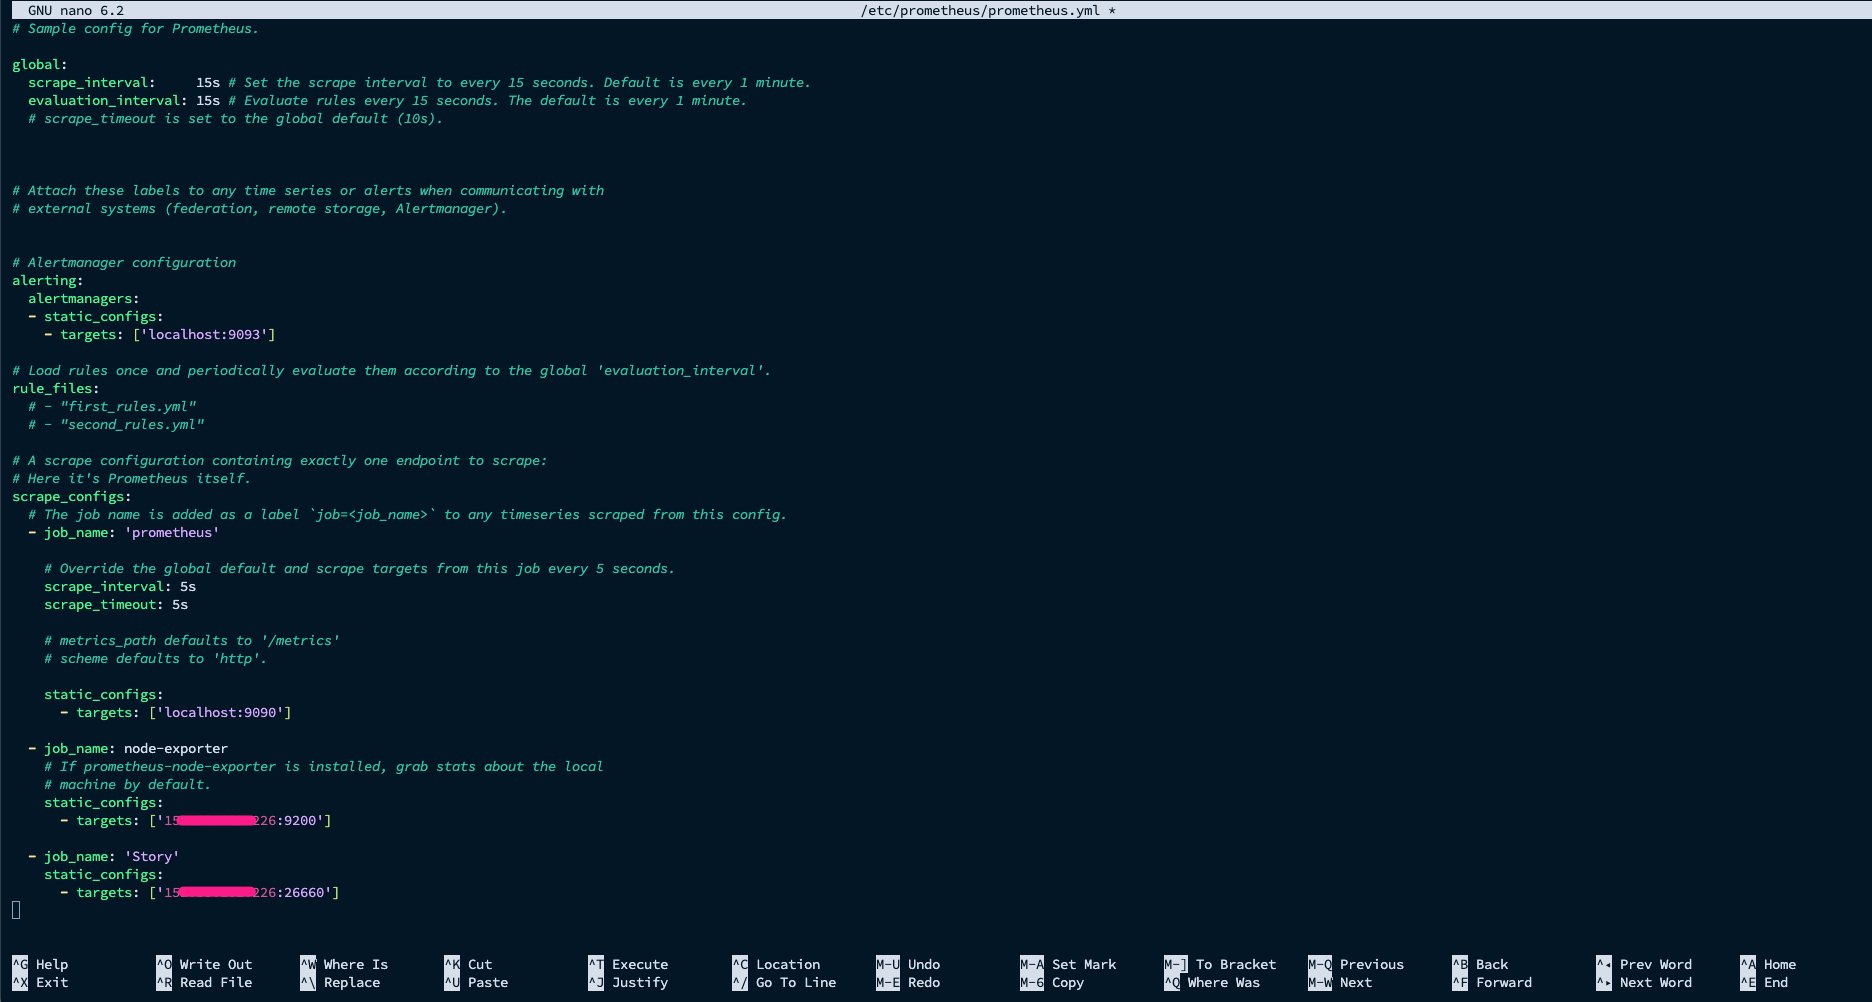
- Explain config:
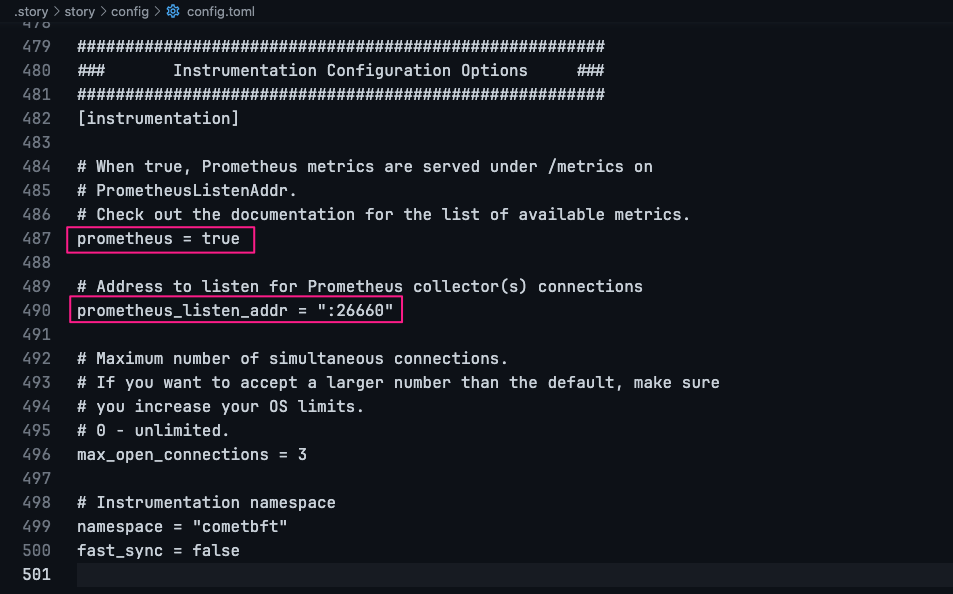
- job_name: 'Story' static_configs: - targets: ['PUBLIC_SERVER_IP:26660']- For config this port
PUBLIC_SERVER_IP:26660you have to edit file at$HOME/.story/story/config/config.tomland Restart Story node
- Set permissions for the configuration file
sudo chown prometheus:prometheus /etc/prometheus/prometheus.yml- Create service file:
sudo nano /etc/systemd/system/prometheus.service- Paste service content:
[Unit]Description=Monitoring system and time series databaseDocumentation=https://prometheus.io/docs/introduction/overview/ man:prometheus(1)After=time-sync.target
[Service]Restart=on-failureUser=prometheusEnvironmentFile=/etc/default/prometheusExecStart=/opt/prometheus/prometheus $ARGS --web.listen-address=:9099 --config.file=/etc/prometheus/prometheus.yml --storage.tsdb.path=/var/lib/prometheusExecReload=/bin/kill -HUP $MAINPIDTimeoutStopSec=20sSendSIGKILL=no
# systemd hardening-optionsAmbientCapabilities=CapabilityBoundingSet=DeviceAllow=/dev/null rwDevicePolicy=strictLimitMEMLOCK=0LimitNOFILE=8192LockPersonality=trueMemoryDenyWriteExecute=trueNoNewPrivileges=truePrivateDevices=truePrivateTmp=truePrivateUsers=trueProtectControlGroups=trueProtectHome=trueProtectKernelModules=trueProtectKernelTunables=trueProtectSystem=fullRemoveIPC=trueRestrictNamespaces=trueRestrictRealtime=trueSystemCallArchitectures=native
[Install]WantedBy=multi-user.target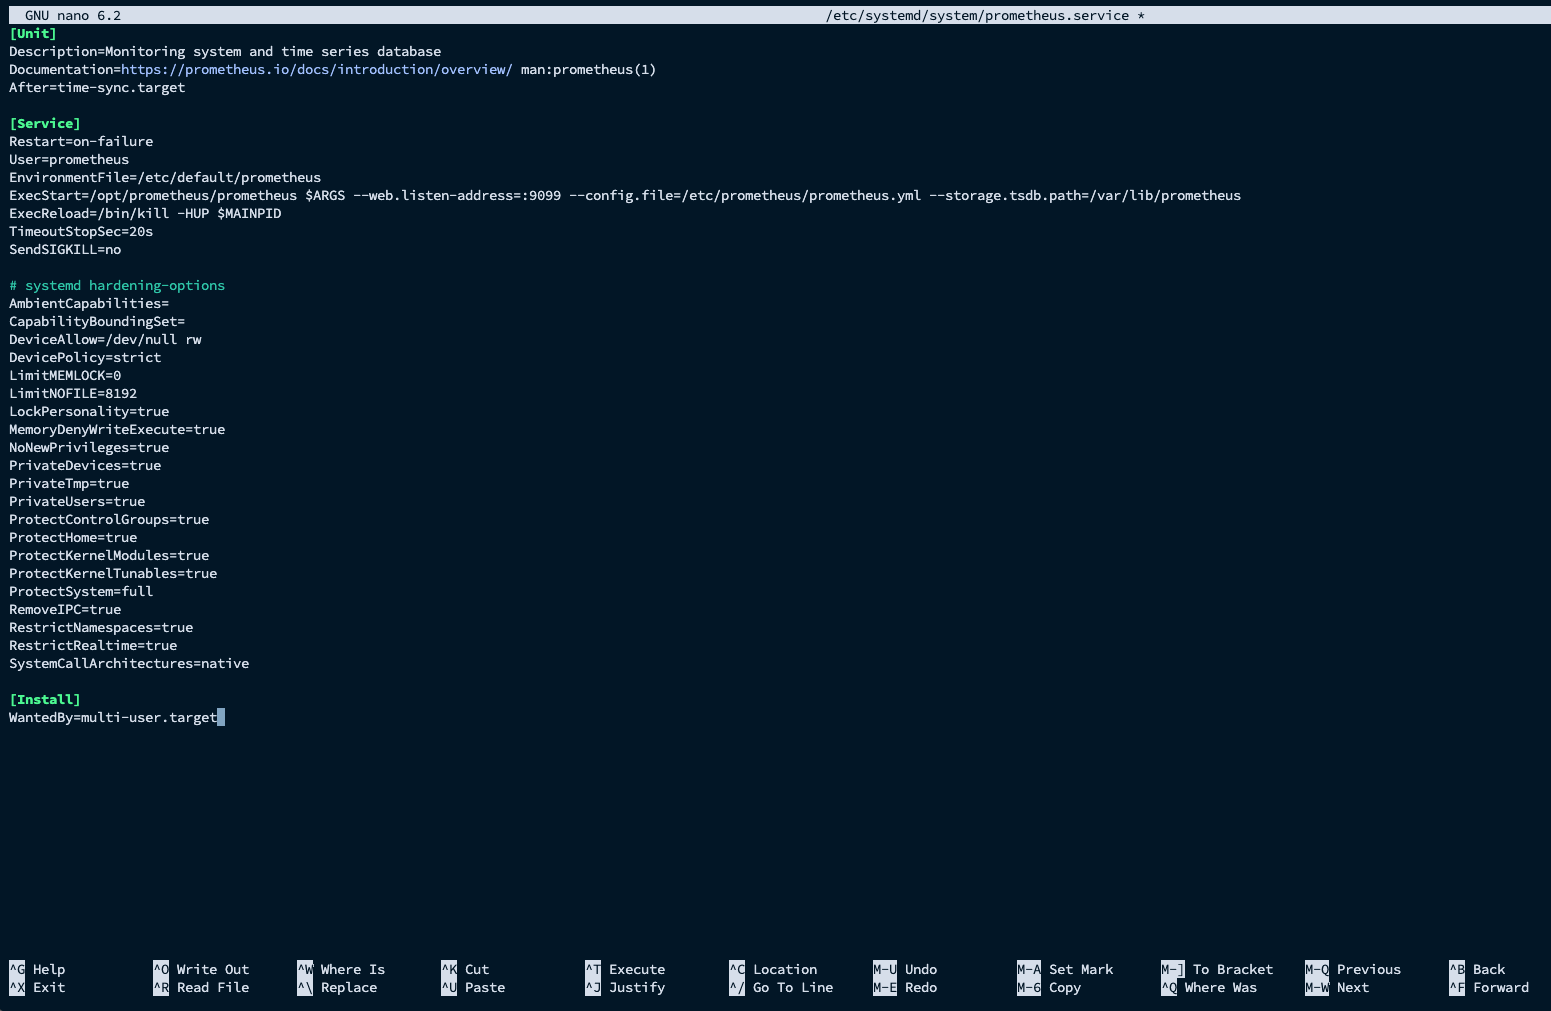
- Start Prometheus:
sudo systemctl daemon-reloadsudo systemctl enable prometheussudo systemctl start prometheussudo systemctl status prometheus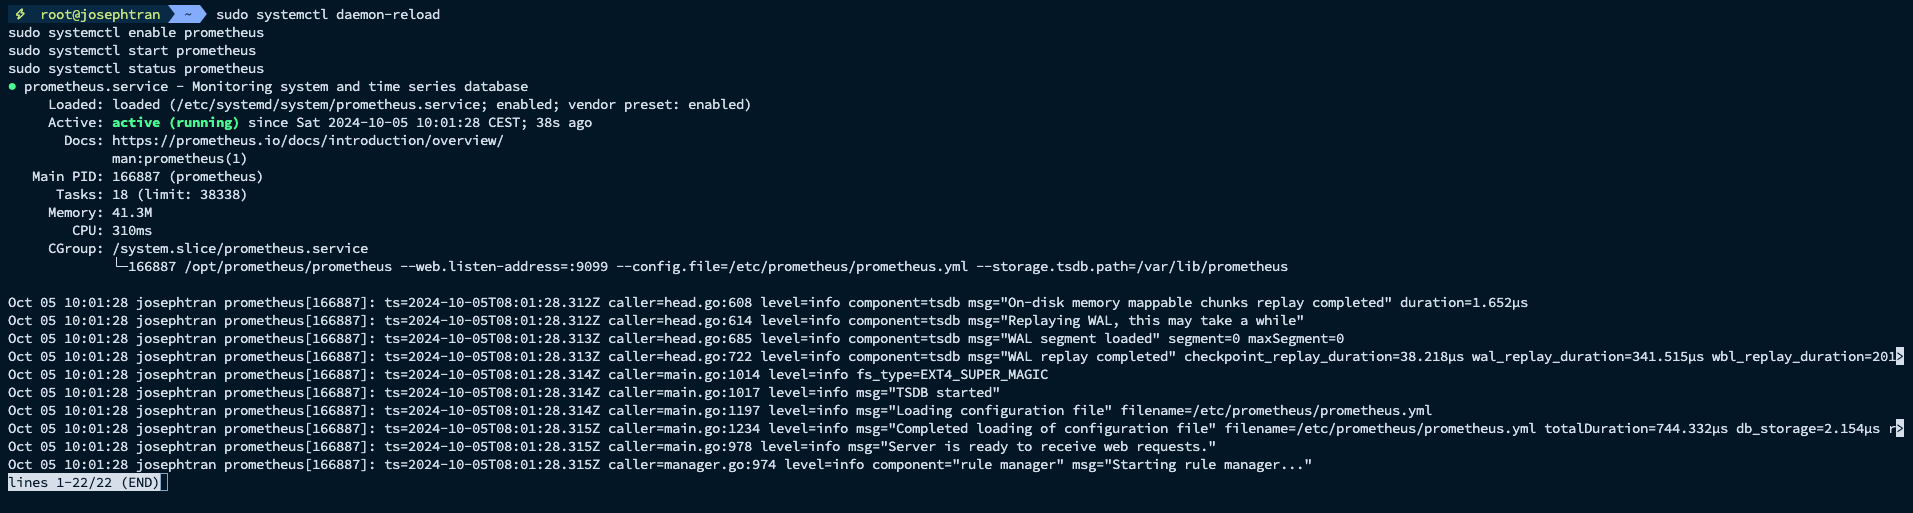
2. Installing Node Exporter
Node Exporter collects hardware and OS metrics.
- Download and install Node Exporter:
cd ~wget https://github.com/prometheus/node_exporter/releases/download/v1.5.0/node_exporter-1.5.0.linux-amd64.tar.gztar xvf node_exporter-1.5.0.linux-amd64.tar.gzsudo cp node_exporter-1.5.0.linux-amd64/node_exporter /usr/local/bin/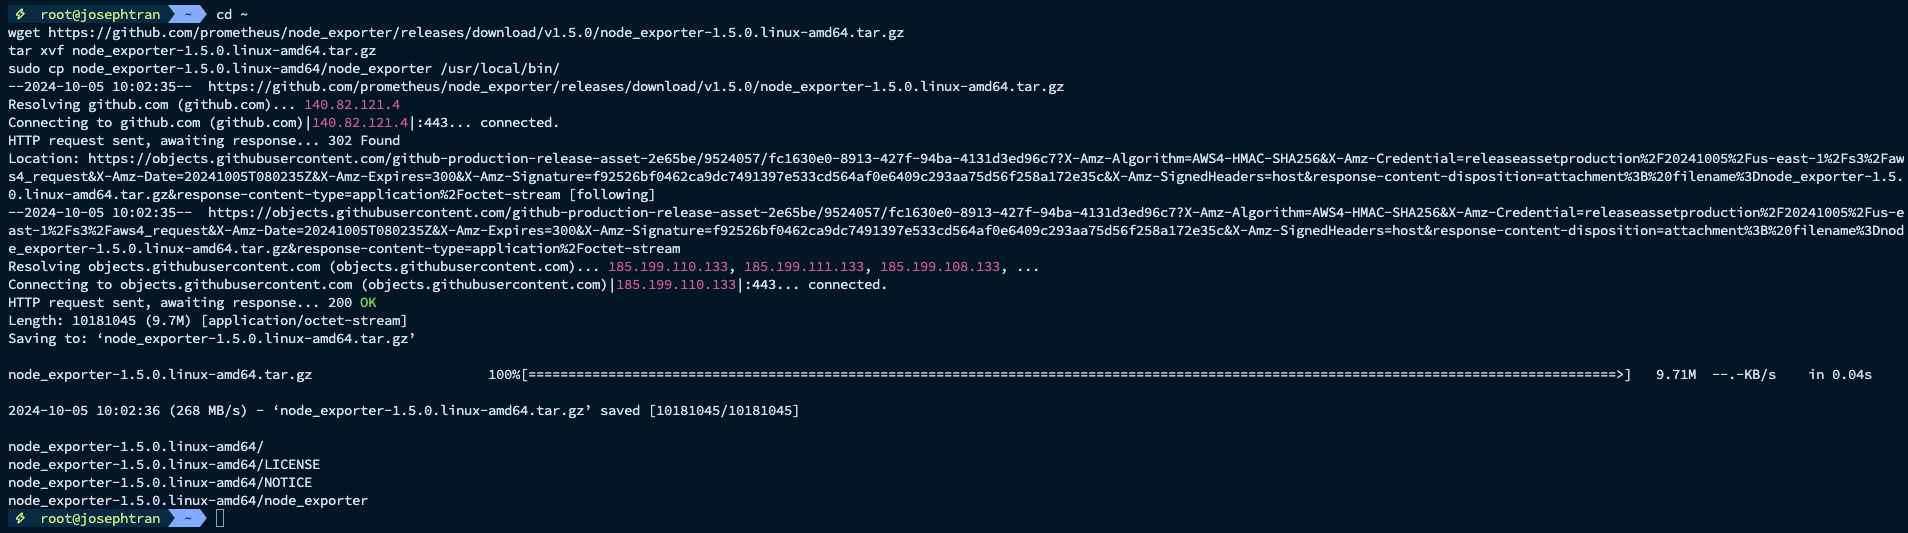
- Create service file:
sudo nano /etc/systemd/system/node_exporter.service- Insert service file content:
[Unit]Description=Node ExporterWants=network-online.targetAfter=network-online.target
[Service]User=rootExecStart=/root/node_exporter-1.5.0.linux-amd64/node_exporter --web.listen-address=:9200Restart=always
[Install]WantedBy=default.target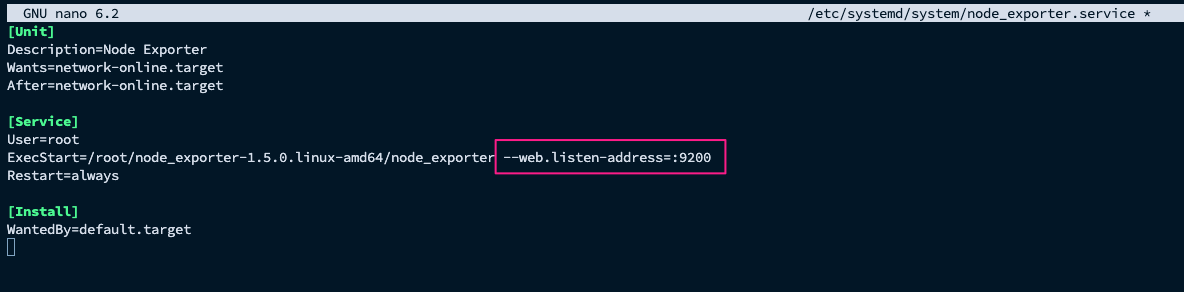
(You can custom port if get conflict)
- Start Node Exporter:
chmod +x /root/node_exporter-1.5.0.linux-amd64/node_exportersystemctl daemon-reloadsudo systemctl enable node_exportersystemctl start node_exportersystemctl status node_exporter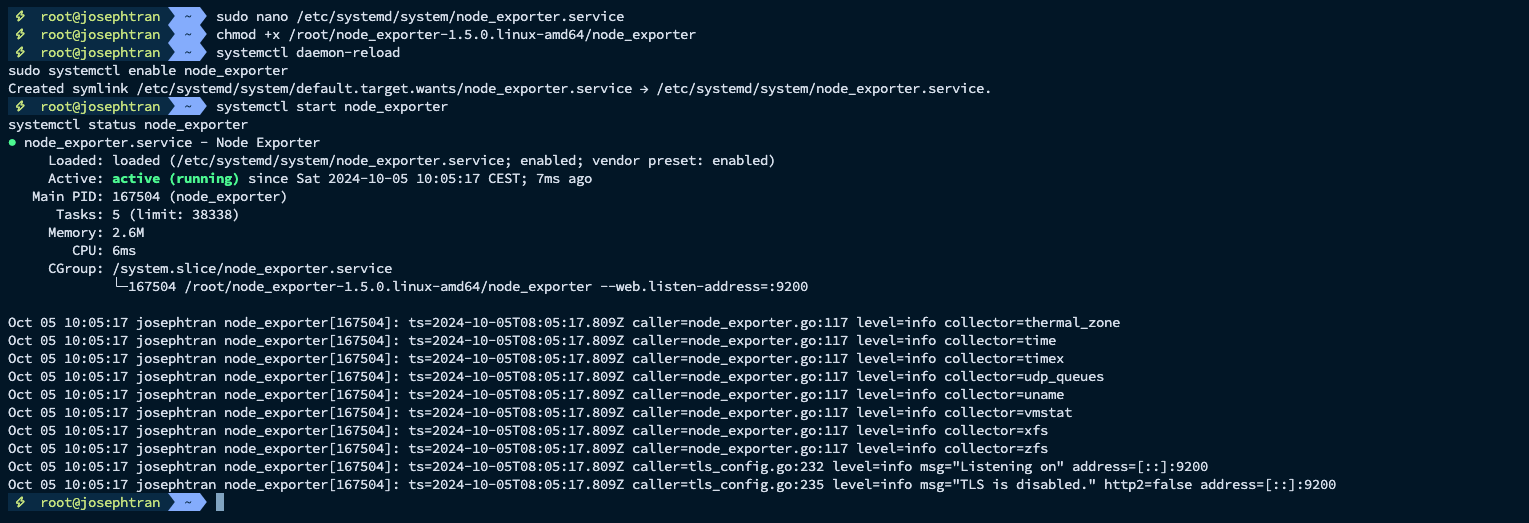
3. Installing Grafana
Grafana is an open-source platform for data analytics and visualization.
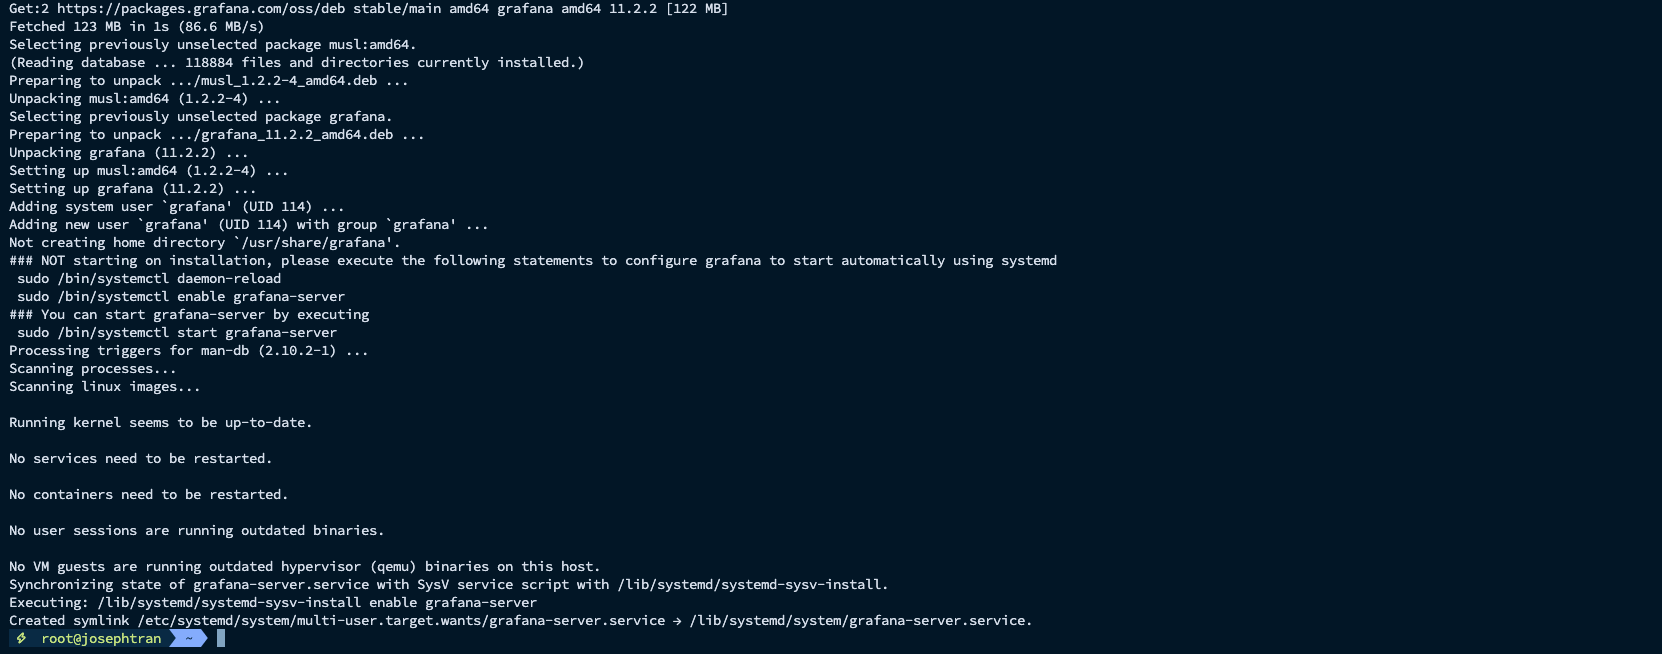
- Install Grafana:
sudo apt-get install -y software-properties-commonsudo add-apt-repository "deb https://packages.grafana.com/oss/deb stable main"wget -q -O - https://packages.grafana.com/gpg.key | sudo apt-key add -sudo apt-get updatesudo apt-get install grafanasudo systemctl enable grafana-server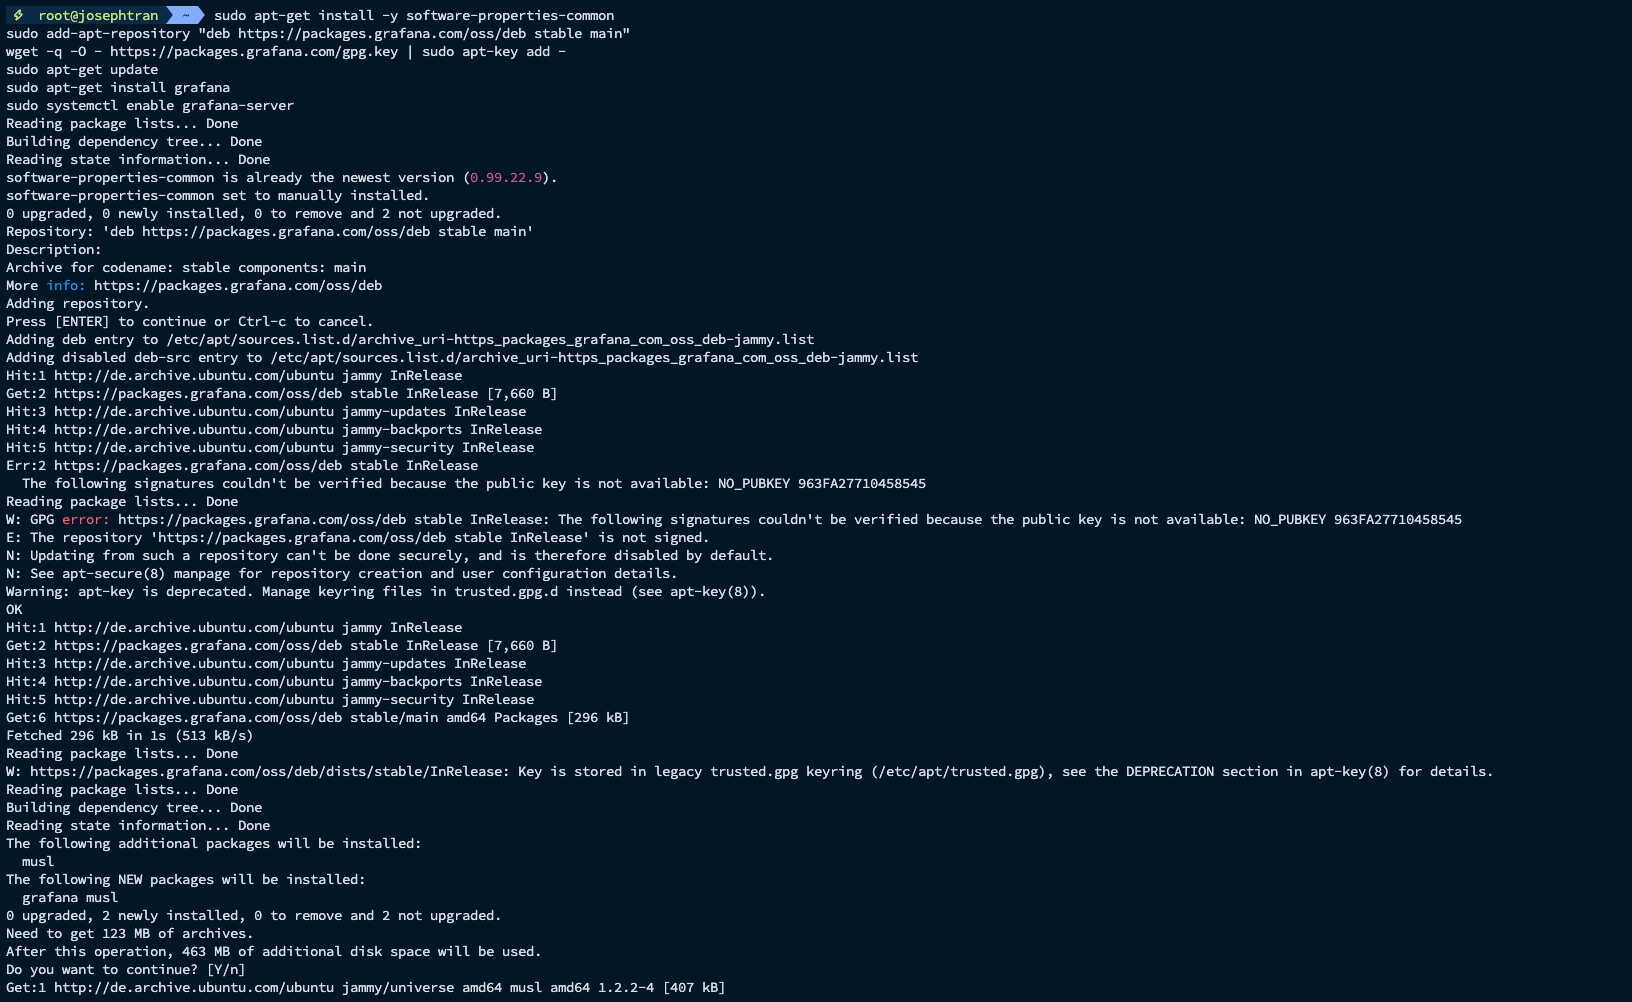
- Start Grafana:
sudo systemctl start grafana-serversudo systemctl status grafana-server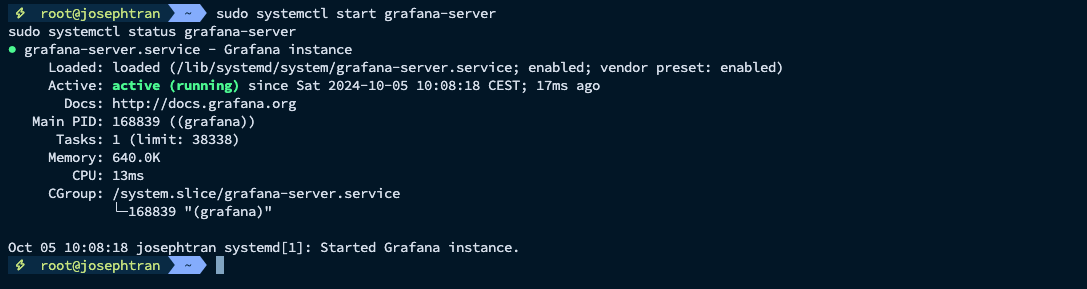
4. Configuring Grafana Dashboard
- Access Grafana web interface:
Open your browser and navigate to
http://your_server_ip:3000
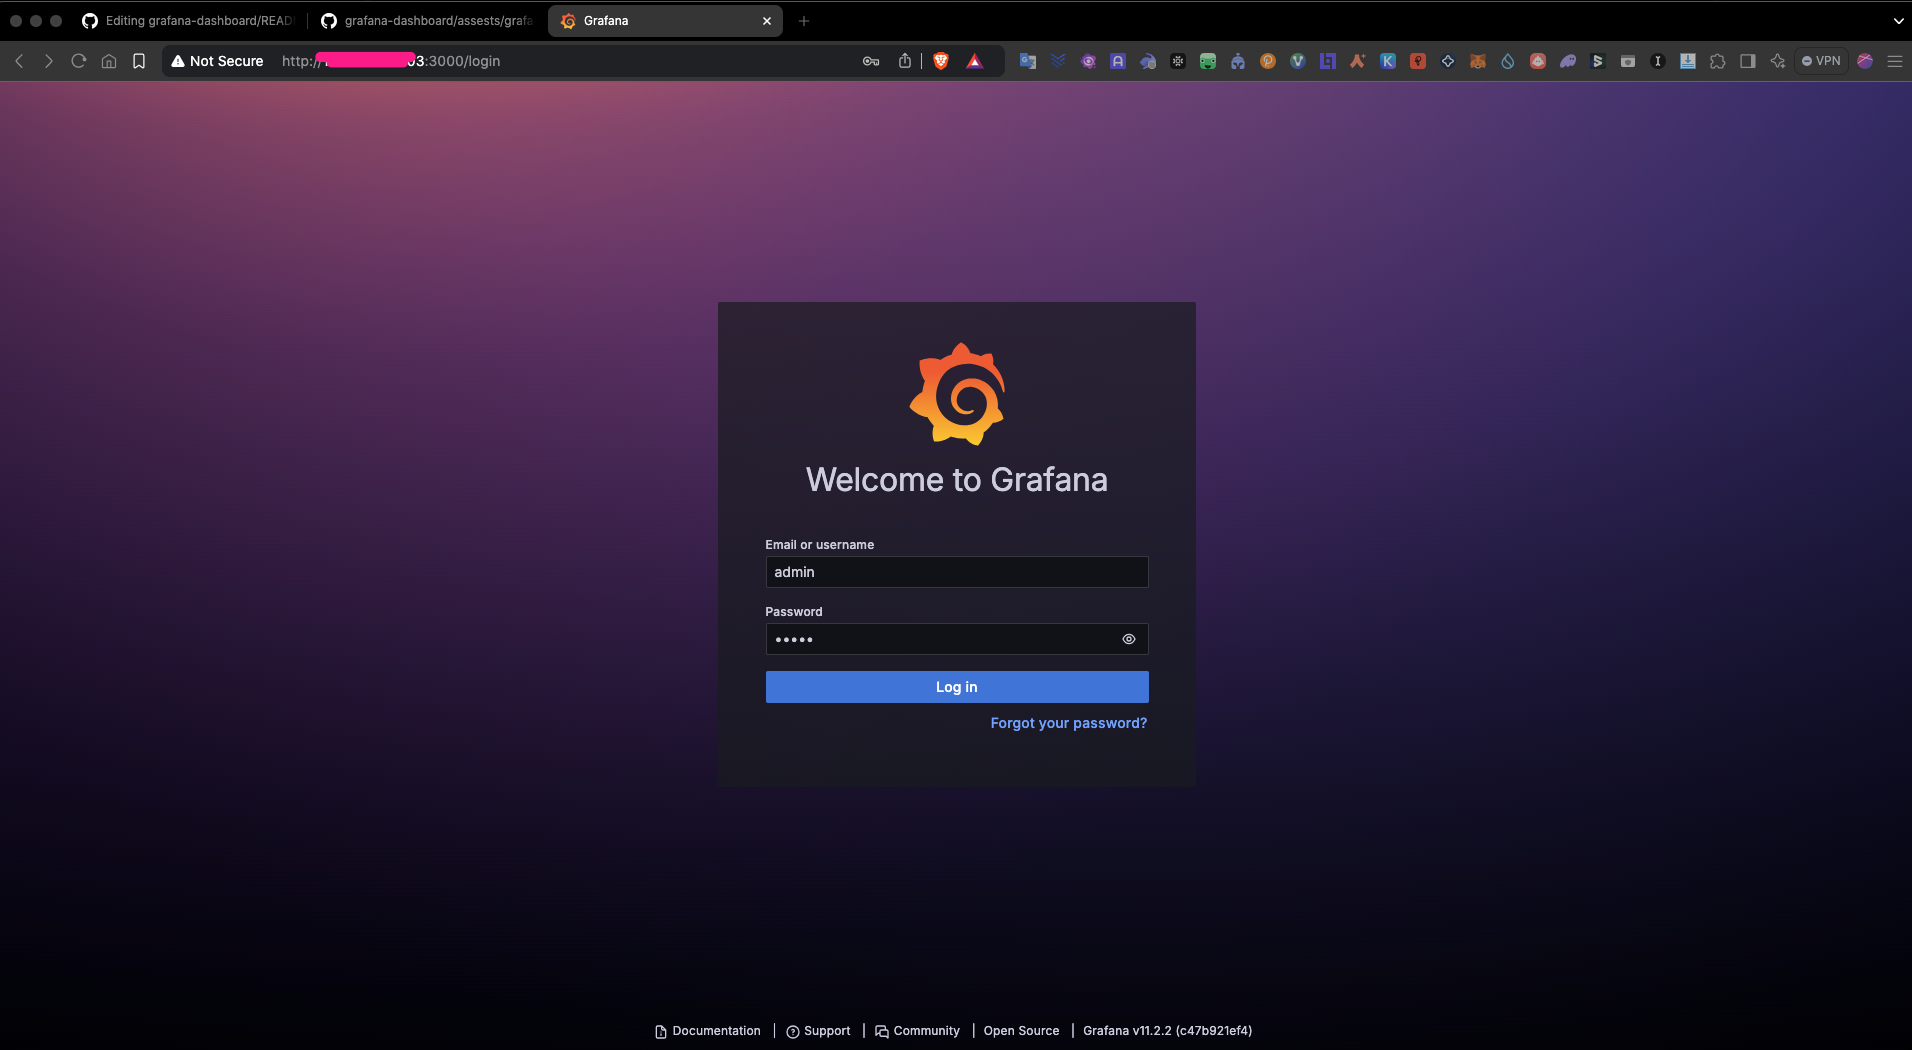
-
Default login:
admin/adminthen change to your password -
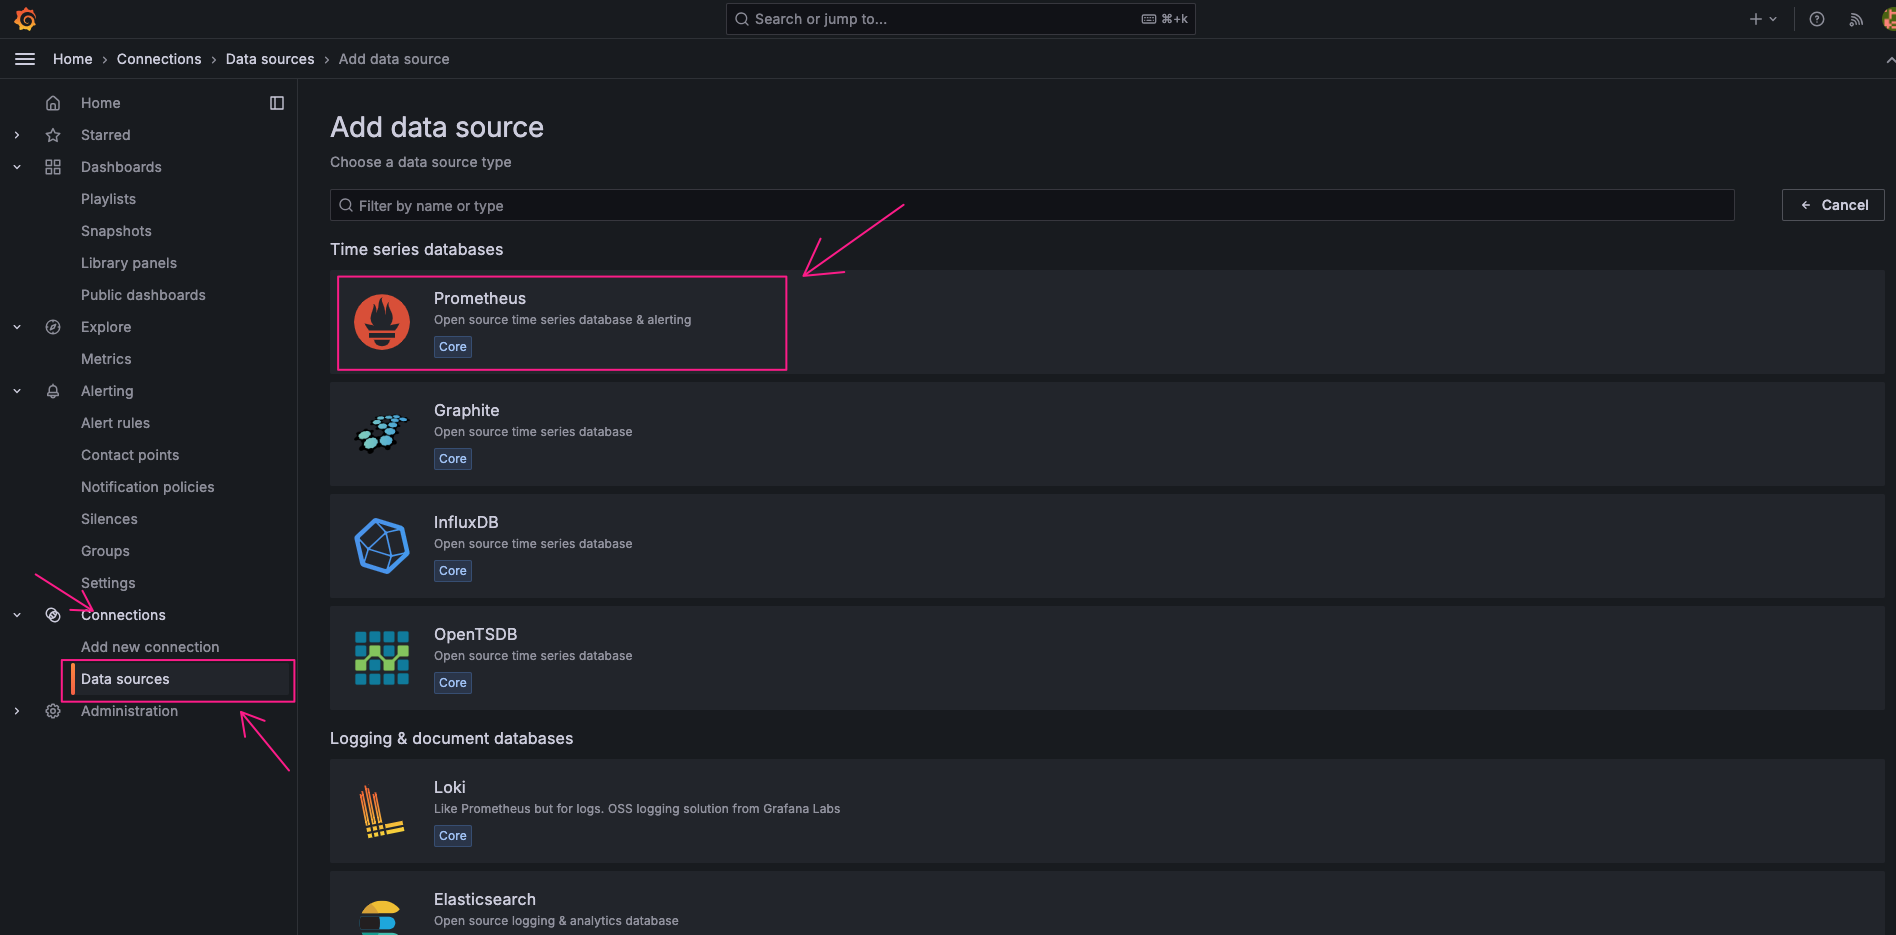
Add Prometheus as a data source: Click
"Add new data source"and select Prometheus
Enter http://localhost:9099 as the Prometheus server URL. (This port the same port in Prometheus service config)
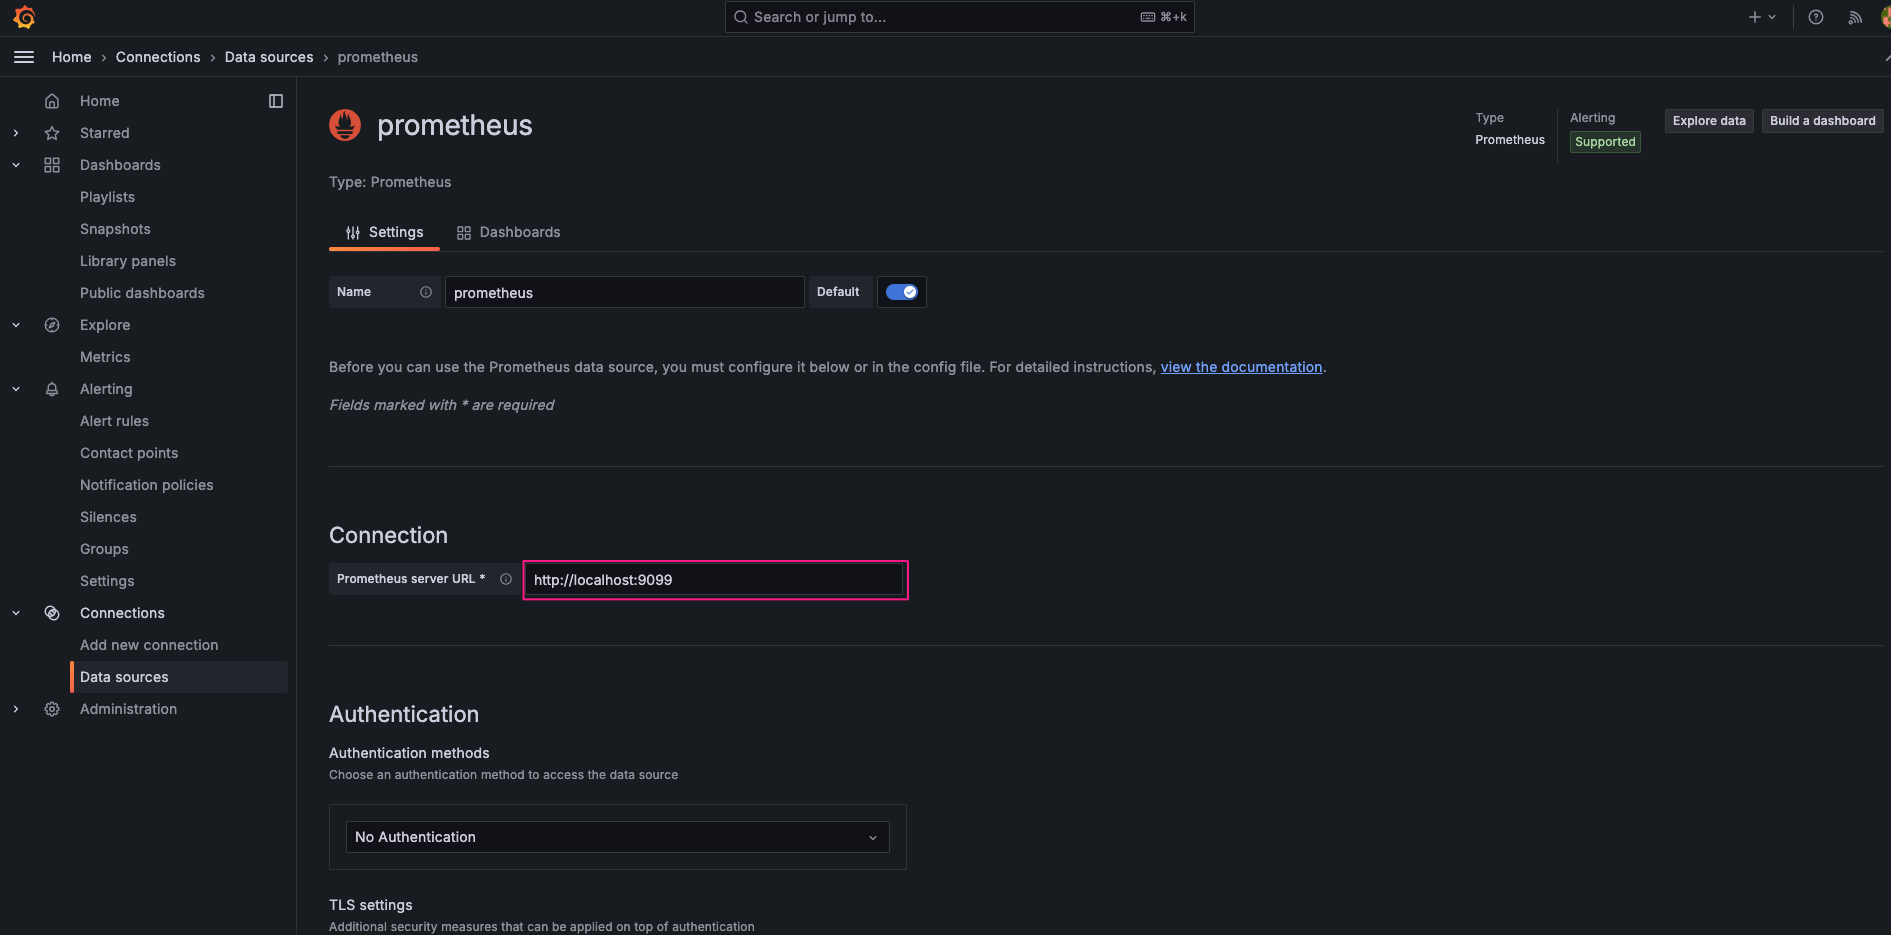
Click "Save & Test" at the bottom
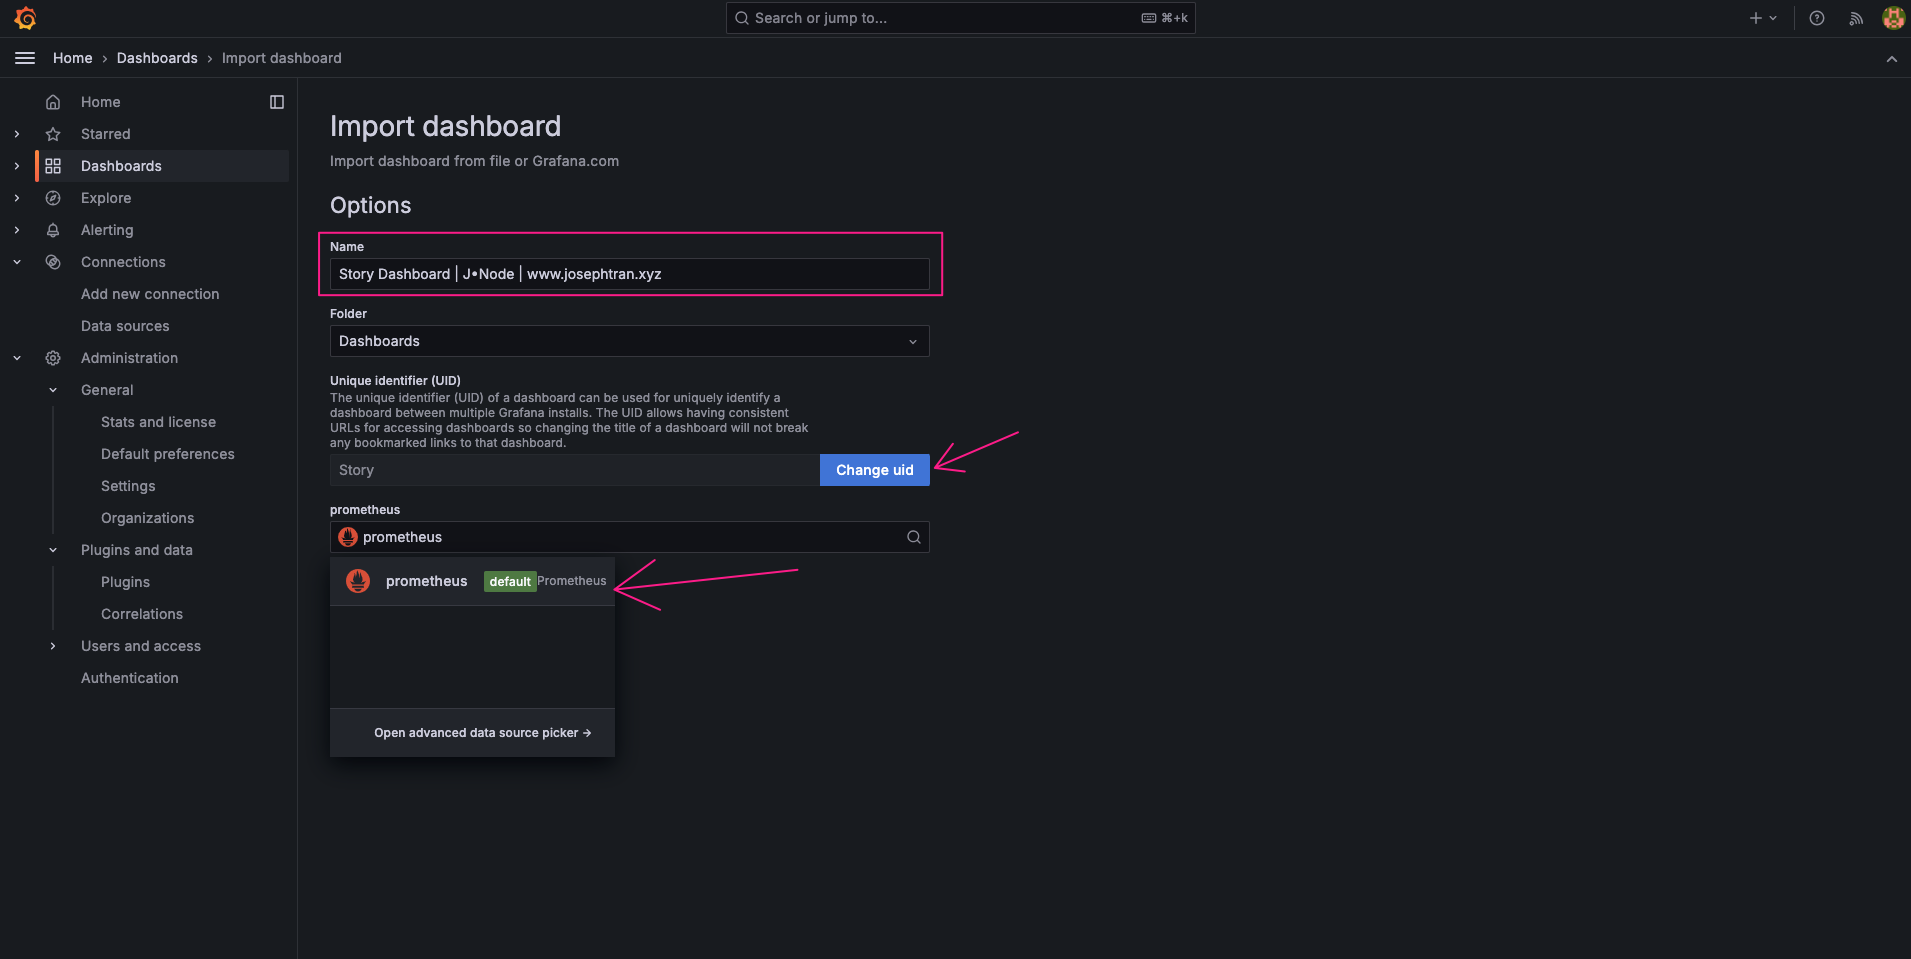
- Import Dashboard: Go to Dashboards and click “Upload JSON file”
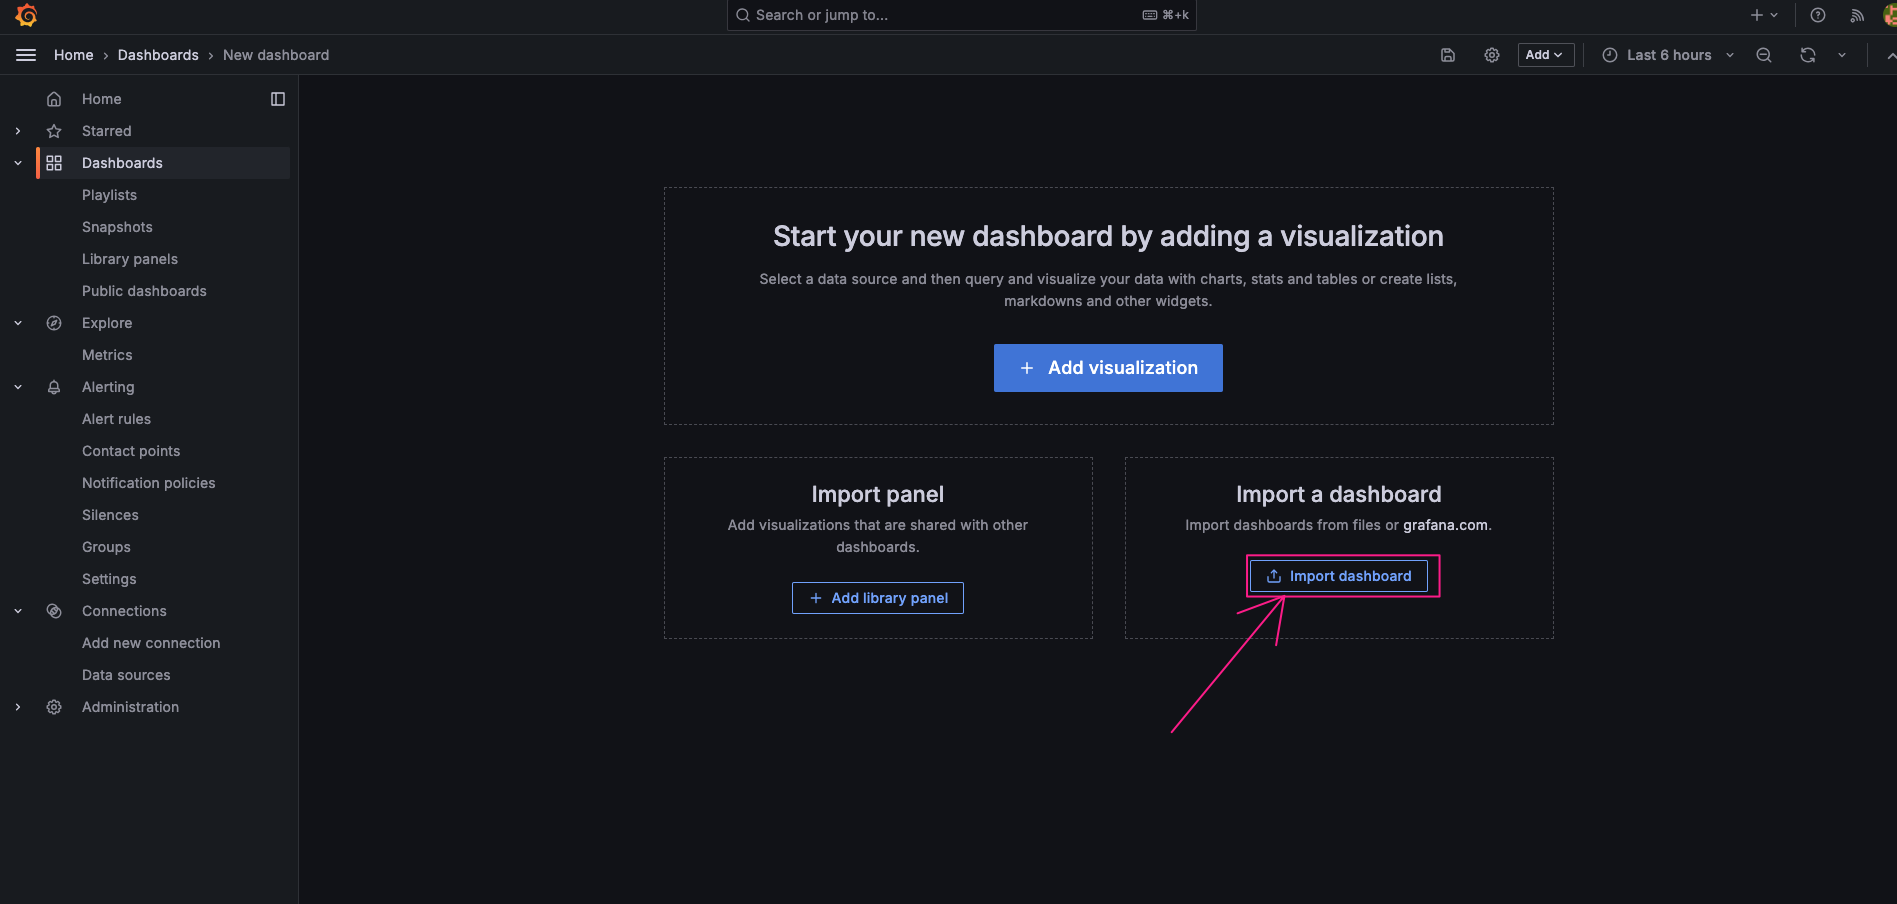
Upload the downloaded JSON file Select the Prometheus data source you just added
Download the Story-grafana-json-file from https://story.josephtran.co/story_validator.json
- Customize Dashboard:
Adjust time ranges, add new panels, or modify existing ones as needed
Preview: https://story-dashboard.josephtran.xyz/ | username: user | password: 123456
5. Troubleshooting
- If Prometheus fails to start, check the configuration file for syntax errors
- Ensure all necessary ports are open in your firewall
- Check service logs using
journalctl -u [service_name]for any error messages
6. Maintenance
- Regularly update Prometheus, Node Exporter, and Grafana to their latest versions
- Backup your Grafana dashboards and Prometheus data periodically
- Monitor disk usage of the Prometheus data directory
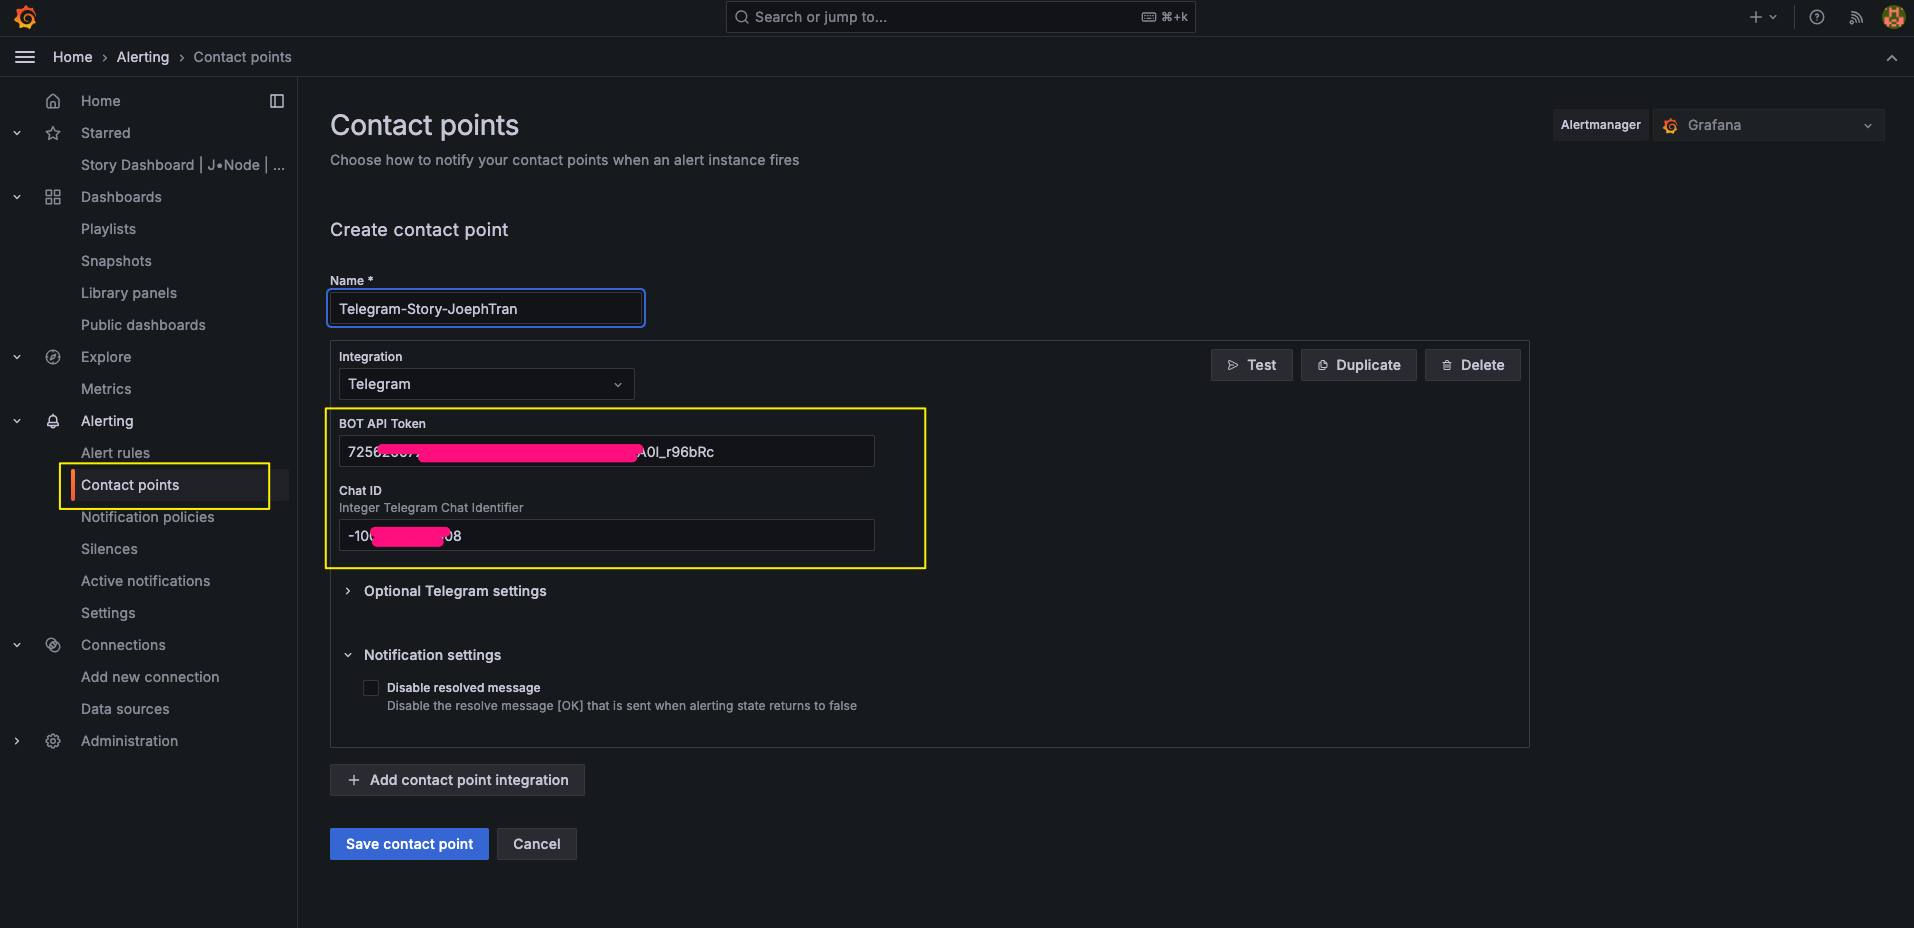
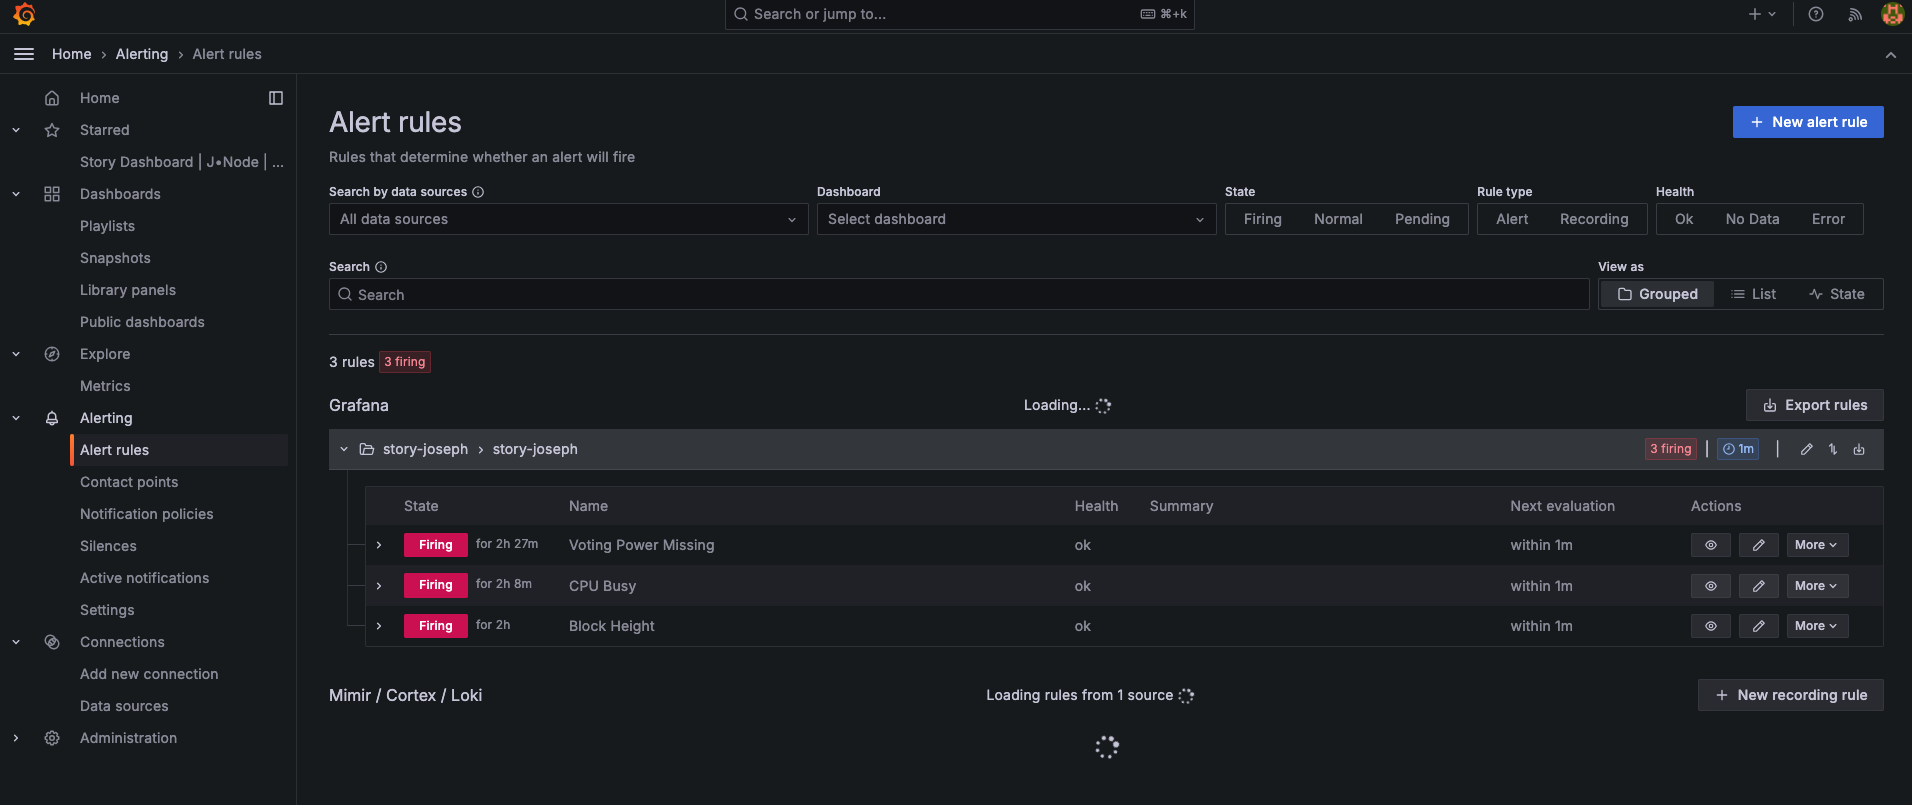
Setup Alert
#Conclusion:
-
You now have a fully functional monitoring system for your node.
-
This setup allows you to visualize system metrics, set up alerts, and gain insights into your node’s performance.
-
Remember to regularly check and update your monitoring setup to ensure it remains effective and secure.
-
This comprehensive guide should provide a solid foundation for setting up Grafana to monitor your node.
-
It covers all the necessary steps from installation to configuration, and includes some basic troubleshooting and maintenance tips.